Since it was established in 2018, news of the scheme has spread far and wide resulting in a year-on-year increase in numbers of beekeepers taking part (no doubt helped by the pandemic lockdown years!). As shown in the plot below, an initial 202 samples submitted in 2018 has increased to nearly 1,500 samples submitted in 2022.

To manage staff time and the scheme’s resources, we have made the decision to limit the number of sampling packs being sent out from 2023 onwards to 1,000 packs per year.
In the scheme’s lifetime we have seen considerable variation in regions across the UK that honey samples have been submitted from:
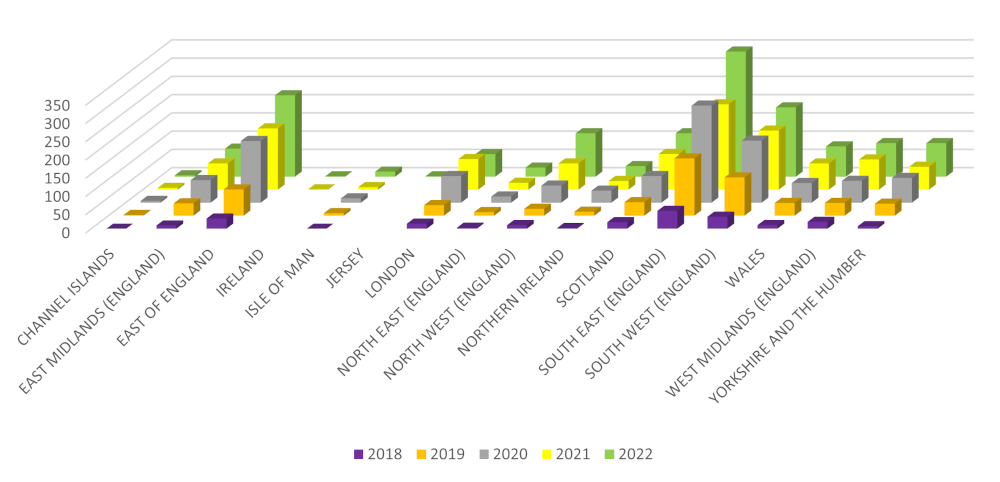
The majority of honey samples we receive are collected from hives in the South East, South West and East of England, followed by the Midlands and Wales, with fewest sent in from North England and Scotland. This is likely because annual honey production reduces from south to north, and we understand why beekeepers are less willing to share their single honey harvest with us! It may also be due to geographic reach, because the scheme is run by UKCEH Wallingford in Oxfordshire, and we have tried to address this with articles in nationwide beekeeping magazines and talks to beekeeping associations all over the UK.
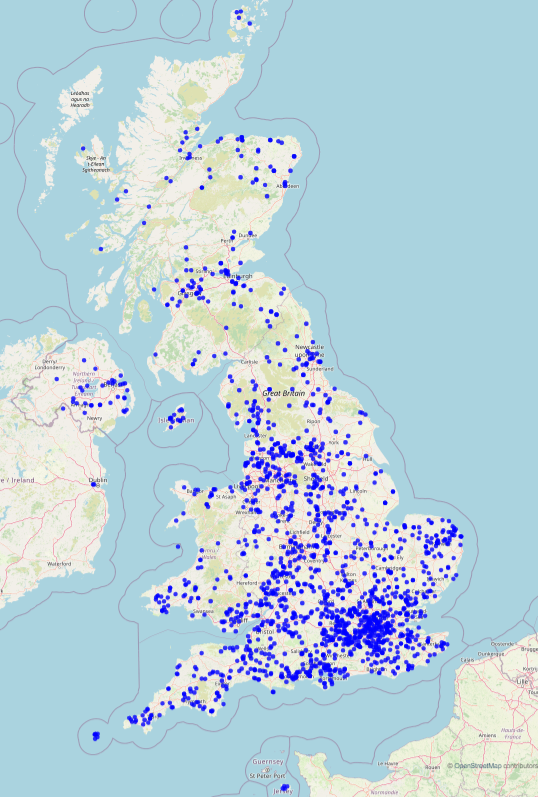
The map below shows where the 1,474 honey samples were sent in from in 2022 – an impressive coverage of hives, as we’re sure you’ll agree! Thank you to all beekeepers who have contributed samples to the scheme since it began.
Beekeeper data - example report
Every time data is added to a beekeeper’s account they will receive an email update, which will take them to an online report with the following sections. The following sections are taken from an example report; results will differ for each sample.
Honey sample characteristics
| Sugar content measured in Brix (%) | 81 |
| Density BE @ 20℃ | |
| Moisture content (% H2O | 17.5 |
| Comments |
These two values give the sugar content and water content of the honey, as determined by a handheld refractometer. The refractometer measures the refractive index (RI) of honey, which is a determination of how light passes through honey and through a vacuum. The ideal water content of honey is below 20% as above this yeasts may ferment and spoil the honey.
Habitats and crops surrounding beehive (a 2km radius)
The habitat and crop data for the 2km around a hive will appear on the report as two pie-charts.
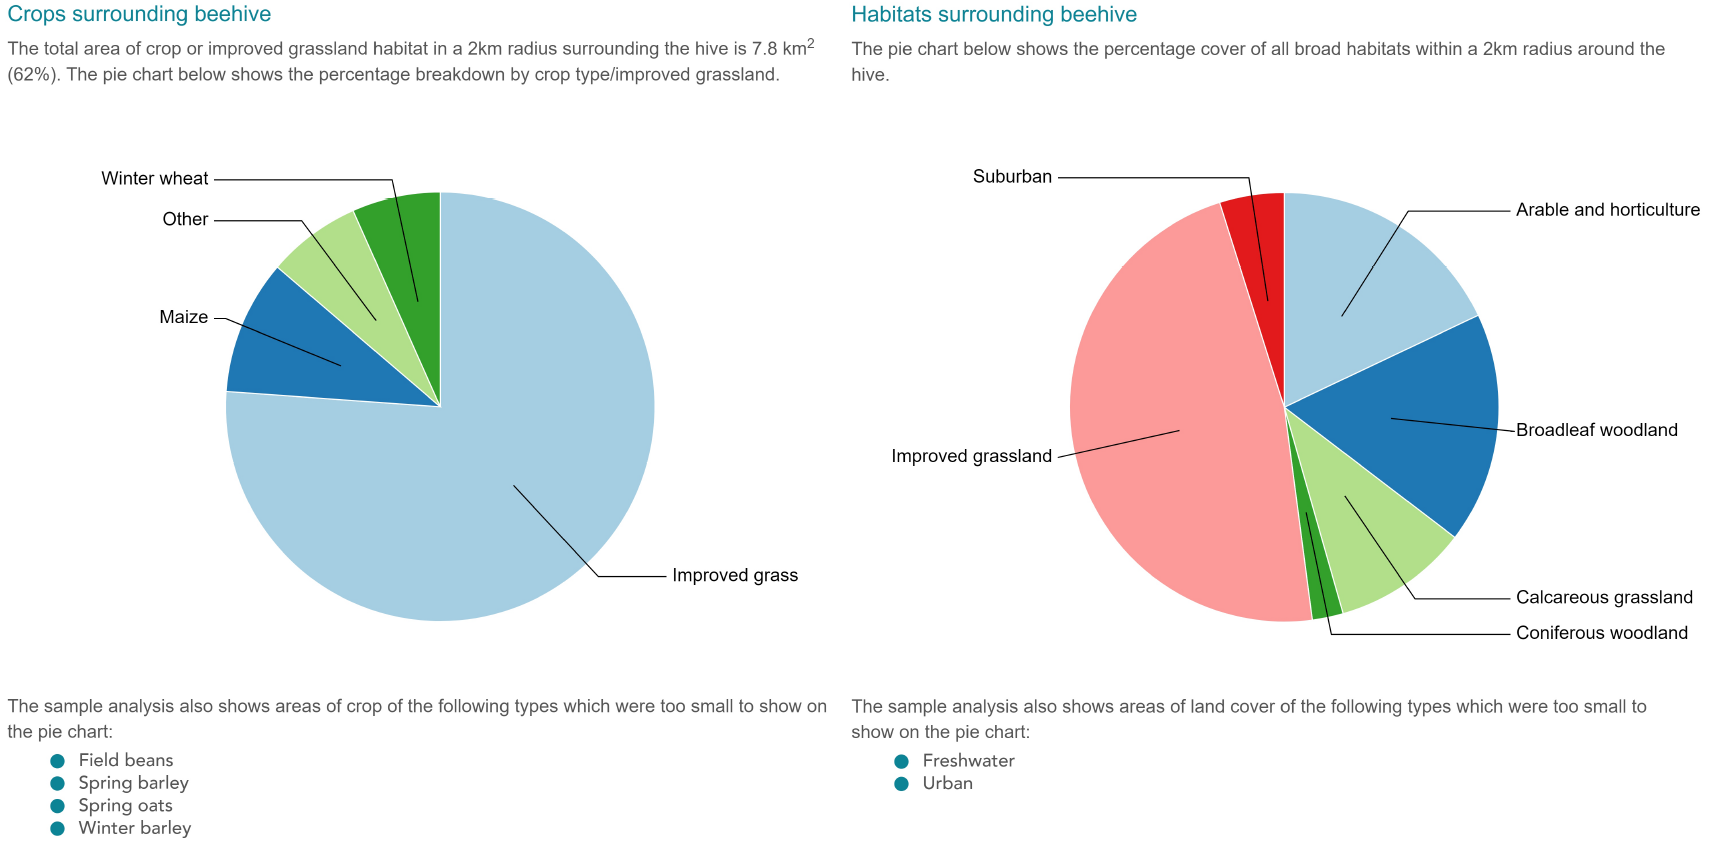
The pie-charts give a breakdown of predominant crops and habitats surrounding the hive, with a list below of other land covers that were present but were too small to show on the pie-chart.
Pollen species results
The final part of the report is the part that beekeepers are most interested in – what plants have your bees been foraging on?
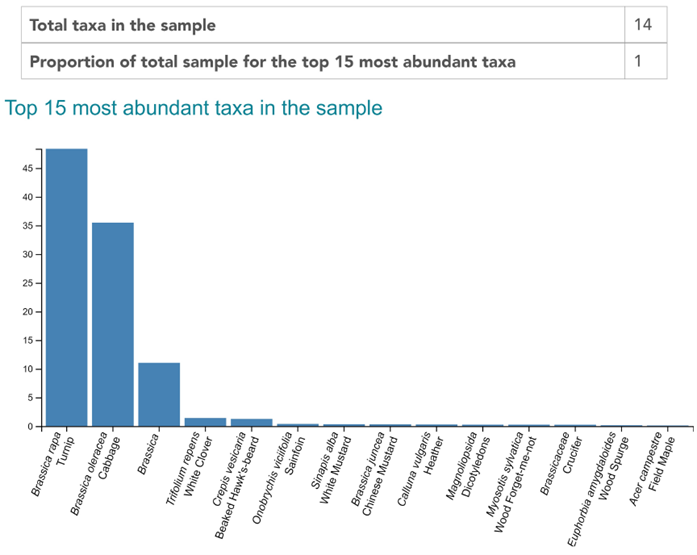
The total taxa in the sample refers to the number of plant species that were identified from the pollen present in the honey. The proportion of total samples for the top 15 most abundant taxa will range from 0-1 and will depend on how many taxa were identified. In this example, 14 taxa were identified in total so they make up the full proportion of the sample (1). If 30 taxa had been identified, then the top 15 taxa would make up 50% (0.5) of the sample’s data.
Below this is a bar chart of the top 15 taxa identified with their scientific name and common name on the bottom axis and the proportion of the sample’s data the represent shown by the bar. For example, the data from this sample was predominantly (48% + 35% + 10% = 93%) from Brassica species i.e. oil seed rape, turnip and cabbage.
A full list of all plant taxa detected in the sample is given below the plot.
If you have received an email notification to say your data is available but you are having trouble viewing the data, please email honey@ceh.ac.uk.
What are bees feeding on?
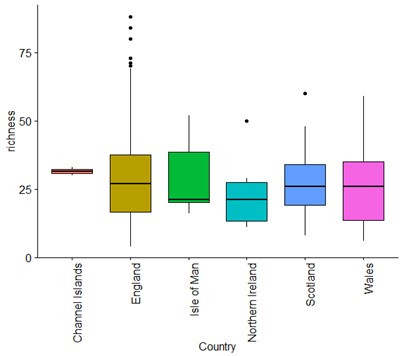
Interestingly the typical number of plant species honeybees are feeding on is remarkable constant across the country. You can see this in the below graph that show the number of plant species we have identified in honey samples collected from different regions across the UK:
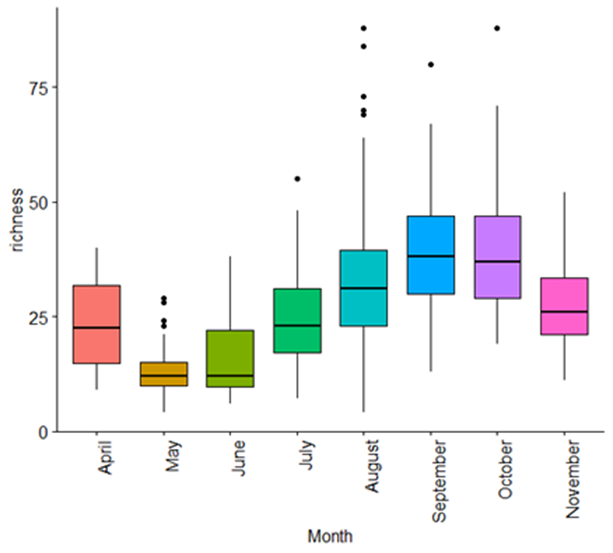
While the number of plant species may remain relatively constant across the year the range of plant species honeybees can feed on changes. This tends to be at a low in May, increasing to a peak in September. This may reflect the lack of floral resources for pollinators in the early springtime which is partly offset by the availability of mass-flowering crops, such as oilseed rape. You can see this trend in the figure below which shows the number of plant species (richness) determined from pollen found in honey according to the month of the year:
We have recorded 100s of different types of plants on which bees are feeding including trees, wildflowers and crops - native as well as non-native species. The table below gives some of the commonest species of plants that we tend to find in honey, and on average the percentage of honey samples we find them in:
| % | Species/genus |
| 24.0 | Brambles |
| 11.2 | Brassicas (inc. crops such as oilseed rape, as well as wild plants) |
| 10.7 | Sweet chestnut |
| 9.2 | White clover |
| 1.7 | Borage |
| 1.7 | Wild radish |
| 1.5 | Privet |
| 1.4 | Himalayan balsam |
| 1.2 | Forget-me-nots |
| 1.0 | Broad beans |
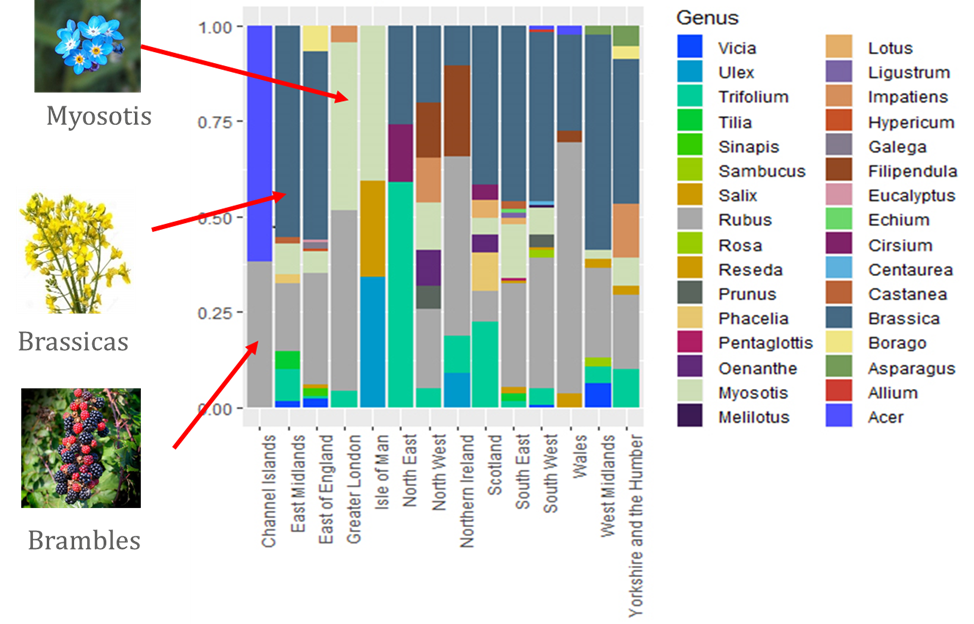
There is, of course, a huge amount of variability between different parts of the country in terms of what the honeybees will feed on. In the below figure you can see how different plant genera are regionally more important in the diets of honeybees that others:
The effect of agriculture on what honeybees feed upon
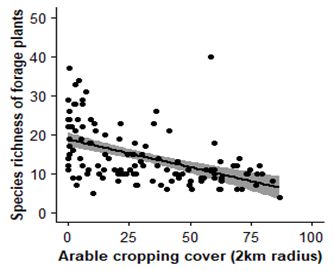
Modern arable agriculture has had a dramatic impact on the availability of wild flowering plants. Habitat destruction and the use of chemical fertilisers and herbicides mean that many once common wildflowers found in arable fields and pastures are no longer seen. Recently agri-environment schemes have tried to reverse this by promoting the restoration of species rich grasslands and the sowing of wildflower field margins next to arable crops. Even so, we find that as the area of arable crops surrounding honeybee hives increases there is a decrease in the number of plant species that they can feed on. The diversity of plant species in bee's diets is likely to play a critical role in bee health by providing a full spectrum of different amino acid proteins and other micro-nutrients. The below graph shows this effect based on pollen found in honey from the National Honey Monitoring Scheme:
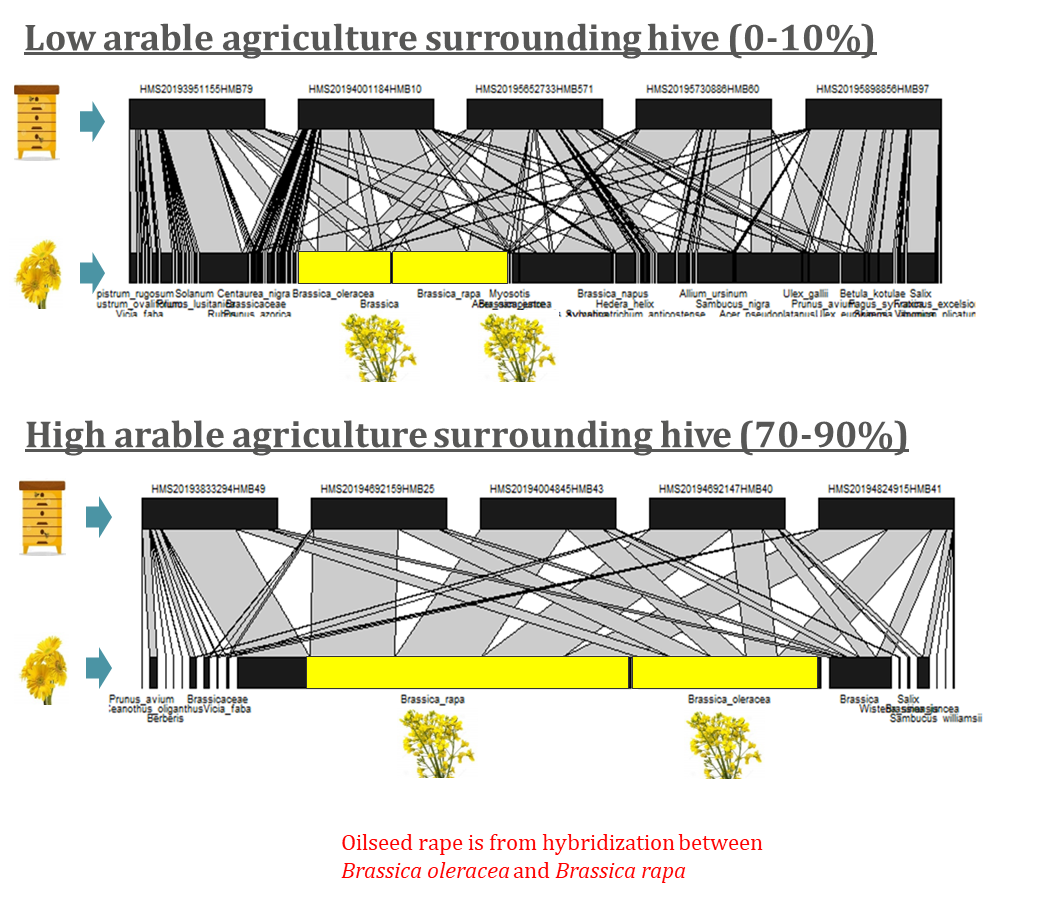
The loss of flowering wild plants often means that honeybees in landscapes dominated by arable agriculture have to make use of crop plants like oilseed rape. While this is a potentially important foraging plant, a dependence on this crop not only places honeybees at risk from pesticide exposure, but again means their diets are becoming simple and potentially impoverished in key amino acids and micro-nutrients. This may affect bee health in the long term. In the figure below shows how the proportion of arable land surrounding bee hives can dramatically affect bee diet. The top plot shows ten hives (black bars on the top rows), five in landscapes with less than 10 % of arable agriculture surrounding the hives. The bottom plot shows five hives in landscapes dominated by arable agriculture (70-90%).
Both plots show the linkages to the plants the bees are feeding on in each landscape type, with each black bar representing a different species. The bigger the bar the more that plant is being foraged upon, with the individual use of each plant species by hive indicated by the connecting grey bars. You can clearly see that honeybee hives in landscapes dominated by arable agriculture are only able to feed on a much smaller number of wild plants, but also depend far more heavily on oilseed rape in their diet (the highlighted yellow bars).
Detection of pesticides in honey - main findings
The following is a summary of the pesticide main findings so far:
- We don’t find pesticide residues at levels that would considered to be any risk to people. However, in many cases bees will be more susceptible to lower levels (sub-lethal) of exposure.
- Pesticides are ubiquitous in honey samples. Most pesticides are at very low concentrations, far below the levels we would expect to have an immediate effect on bees, but they are found in most honey samples to some extent.
- Most honey samples will have at least one pesticide - some can have >15. This is worrying as there is increasing evidence that some pesticides can negatively interact so that combined they have higher toxicity than alone. These effects are very hard to predict but new research is suggesting they may be widespread.
- Pesticide residues are found in samples from agricultural, urban and semi-natural environments. While it is no surprise that honeybees kept close to agricultural land may be exposed to pesticides, what is surprising is that they are detected everywhere. Urban environments also pose a problem, largely due to pesticide use in domestic gardens and for amenity use in parks and golf courses. Even where bees are kept in areas with little or no arable agriculture or urban habitats they are still often found to have pesticide residues in their hives.
- Banned pesticides are regularly detected. We think this relates to residues that remain in agricultural land long after the product has been banned, as well as what is known as legacy use where gardens use old products they have lying round long after they are no longer legal.
This plot shows the number of pesticide types found within honey samples collected in 2021 from arable and horticultural landscapes (early = May, late = August), as well as in urban and semi-natural landscapes. The graphs show distributions of the frequency with which that number of active ingredients are found - a bit like a distribution of body heights that goes from the very short to very high.

What are we doing now?
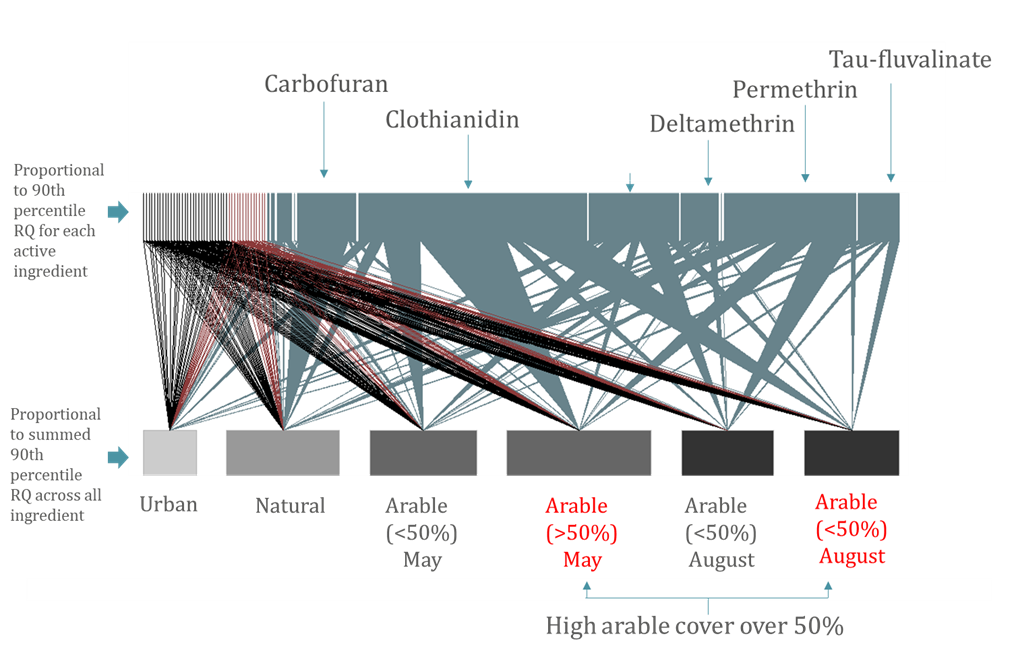
We are working with Defra and the Health and Safety Executive (HSE) to develop indicators of risk. This is important as not all pesticides are as toxic as each other. We are now developing ways to use information on how toxic pesticides are to provide more information on what the pesticides are doing to bees, and ultimately provide an early warning of whether certain products are posing an unexpected risk. One important way we consider the relative effect of pesticides on bees is though what is called a risk quotient. In ecotoxicology this is the ratio of the exposure to a pesticide (how much pesticide a bee eats) to how toxic that pesticide is (how much of that pesticide if eaten by bee would kill on average 50% of bees). Using these new tools we can get an improved understanding of which pesticides found in bee hives pose the greatest risks.
In the below diagram you can see how different pesticide pose different levels of risk to honeybees. Each bar on the top row represents a different pesticide (black bars are fungicides, red bars are herbicides and grey bars are insecticides). The width of these bars is proportional to the higher risk quotients we typically see from the honey samples collected in 2021. The triangles connecting bars to the bottom row show which landscapes within which hives are places that these pesticides are typically most commonly associated with. As you can see fungicides (black) and herbicides (red) are of low risk to honeybees. However, it’s the insecticides that remain a problem, including in 2021 the neonicotinoid clothianidin which has been banned since 2018 but is still commonly found in honey.
The value of information on bee disease provided by beekeepers
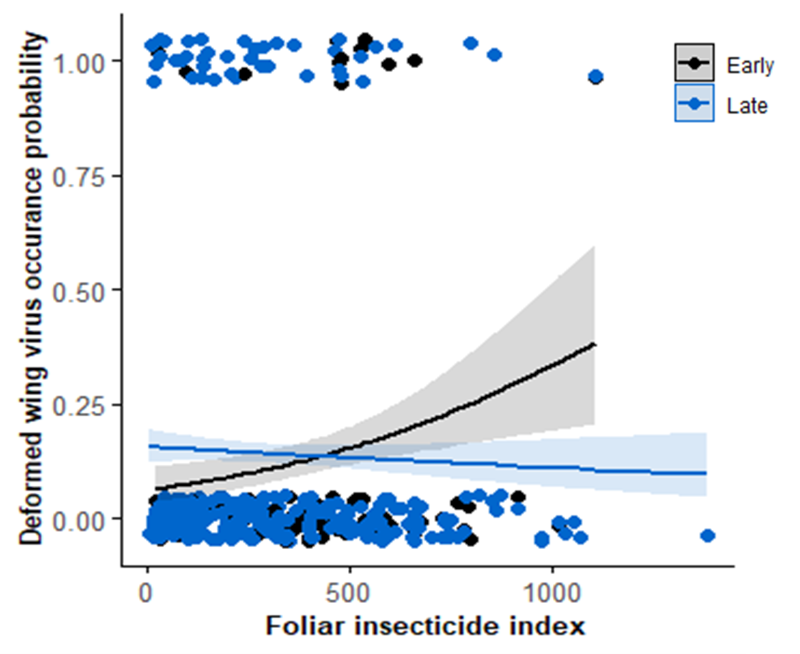
When beekeepers provide honey though the NHMS we also ask for is additional information on how productive the hives have been as well as information on bee health. We have been able to use this information in part to look at how exposure to pesticides can affect bee health. This is currently a big concern. While exposure to pesticides may not be high enough to cause honeybees to drop dead instantly, long term and low levels of exposure may still be a problem impacting on the bees ability to resist diseases. In a recent study we showed that where honeybee hives were kept in landscapes that had high levels of insecticide use they were typically more likely to suffer from deformed wing virus, although this effect was only seen early in the year when the use of insecticides on crops is highest.
